Methodology document here.
Methodology Overview
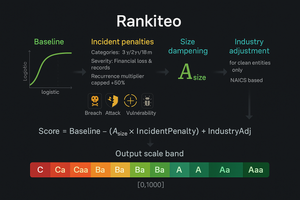
Baseline (size-aware foundation)
Organizations begin with a size-aware baseline (logistic-shaped) that typically falls around the high-700s to mid-800s for clean large caps. This reflects process maturity and disclosure rigor without granting immunity from penalties.
Incident penalties (time & severity)
Each event category contributes an additive penalty that decays exponentially. Typical half-lives are approximately 3 years for breaches and ransomware, 2 years for cyber attacks, and 18 months for vulnerabilities. Severity is modeled via financial loss and records exposed, normalized to firm size and globally capped. Ransomware recurrence applies a bounded multiplier to reflect clustering risk.
Size dampening (fairness by design)
Very large organizations have more disclosure and attract more adversaries, but they also absorb incidents better. A smooth size factor dampens (never erases) penalties at extreme scales, preserving comparability between small/mid caps and trillion-dollar firms.
Industry adjustment (only when clean)
An industry factor (NAICS-based) provides a modest adjustment for entities with clean or near-clean recent records. Once you accumulate fresh exposure, realized history dominates; sector priors step aside.
Composition (plain-English formula)
Final Score ≈ Baseline – (Size‑dampened Incident Penalty) + Industry Adjustment, clipped to [0, 1000].
Score Bands & Color Palette
Rankiteo’s bands translate numbers into plain English and an intuitive color palette from red (critical) to green (excellent). These bands appear consistently across dashboards, reports, and compliance badges.
| Range | Label | Rating Code | Color |
|---|---|---|---|
| 0–549 | Critical | C | #F24D4D |
| 550–599 | Very Poor | Ca | #F05A5A |
| 600–649 | Poor | Caa | #E27A6C |
| 650–699 | Weak | B | #D29A66 |
| 700–749 | Moderate | Ba | #B9B97D |
| 750–799 | Fair | Baa | #89CABB |
| 800–849 | Good | A | #6FD0AF |
| 850–899 | Very Good | Aa | #55D6A3 |
| 900–1000 | Excellent | Aaa | #3DDC97 |
How the Score Is Used
Boards & Executives: Monitor directional progress, set risk appetite, and communicate posture in disclosures and investor relations.
Security & Risk Teams: Map score movements to incidents and remediations; forecast recovery based on decay; show the effect of patching, segmentation, and vendor hardening.
Underwriters: Compare insureds using severity normalization and caps; combine the score with questionnaires and scanning for a fuller picture.
Investors & Lenders: Use a standardized resilience metric in diligence and portfolio surveillance.
How to Improve Your Score
- Eliminate fresh exposure: close open vulnerabilities; harden identity, email, and third-party controls.
- Reduce blast radius: least privilege, segmentation, encryption, and data minimization.
- Prevent recurrence: treat ransomware clusters as a top priority; monitor privileged access and endpoint hygiene.
- Harden external posture: maintain asset inventories, patch cadences, certificate hygiene, and secure configurations.
- Test and drill: tabletop exercises, incident response tests, and backup restores.
- Prove and communicate: align with frameworks (ISO 27001, SOC 2), track metrics, and publish improvements. Add your compliance badge on your Rankiteo company's page.
Common Misconceptions & Limitations
A cybersecurity score is not a guarantee against future incidents, nor does it replace architectural reviews or testing. It is an evidence-driven indicator of realized exposure and resilience. The model enforces caps and decay to avoid distortions, but extreme, sustained events can still depress a score until remediation is proven. Transparency is critical: Rankiteo publishes its design choices so stakeholders can evaluate fit-for-purpose.